Introduction
The market is flooded with many home automation products that includes environmental sensors, smart light bulbs, smart switches and others. The technologies that connect these devices include Bluetooth, ZigBee, Z-wave, or Wi-Fi. The common pattern of using these products is to use a mobile app to access the sensors.
This approach raises two concerns: the first is the privacy of users, since all the sensor data and controls are hosted in the cloud and untheorized access to this data can reveal too much information about the lives of the user. The second concern is the dependency on the Internet service and reachability to the Cloud. Disruption to these services renders these products unusable.
Luckily, there are many open source tools that allow the user to avoid using the Cloud and keep both the data and the control of the smart devices local. This blog explores the use of some of these options to connect a pair of temperature and humidity sensors.
This blog describes the process at high level of detail; therefore, it the reader must be able to search for detailed procedures and apply them.
Components
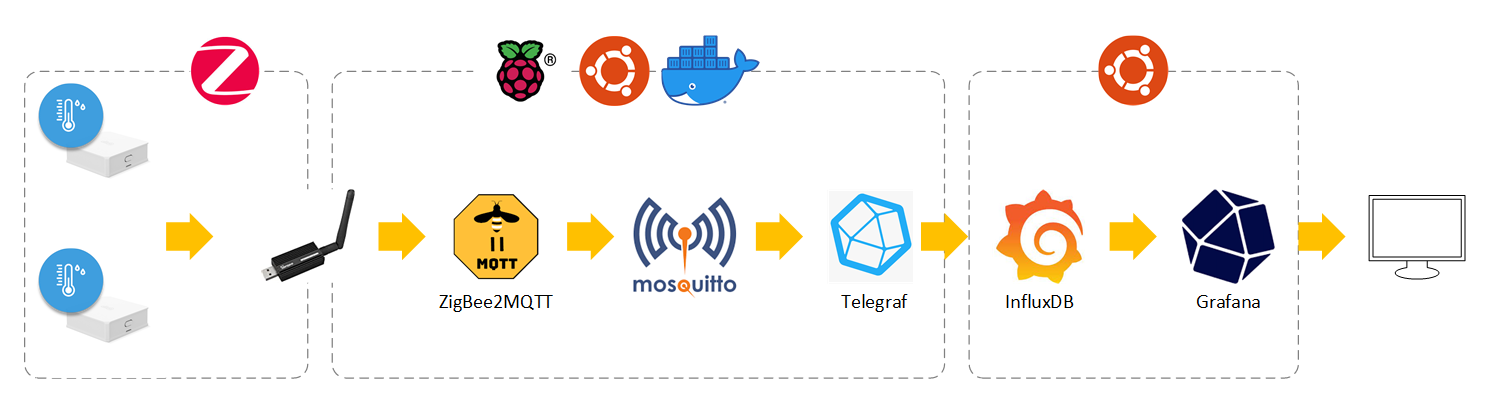
The figure below shows all the components used in the system. Two sensors use ZigBee technology to connect to a hub that provides an interface to the home network. Rather than a standalone device, a USB dongle attached to a Raspberry Pi is used a ZigBee coordinator . A tool, ZigBee2MQTT reads the data from the coordinator and publish it to an MQTT broker. Another tool, Telegraf, subscribes to MQTT and sends the data to an InfluxDB databases, which can be viewed by Grafana.
Note: Both InfluxDB and Grafana were pre-installed, so I will not describe their installation process here.
The remaining components are:
- Hardware
- SONOFF Zigbee 3.0 USB Dongle Plus (CC2652P)
- SONOFF ZigBee Indoor Temperature and Humidity Sensor (SNZB-02)
- Raspberry Pi 3 Model B (with Micro SD card)
- Software
- Ubuntu 22 for Raspberry Pi
- Docker Engine
- Docker Compose
- zigbee2mqtt
- Telegraf
Installation
Here are the installation procedures for each component.
Raspberry Pi
- Download Ubuntu Server 22.04.1 LTS
- Install the OS following these instructions
Docker
- Install Docker Engine and Compose using the repository method.
zigbee2mqtt
- Connect the SONOFF Zigbee 3.0 USB Dongle to one of the Raspberry Pi’s USB ports.
- Install ZigBee2MQTT following this installation procedure
- Connect the two SONOFF sensors
Telegraf
Telegraf is used as an MQTT client that collects data from the MQTT broker and sends to the InfluxDB server in a compatible format. Here, we will use official Telegraf Docker image.
- Add the Telegraf image to the docker-compose.yml:
<ommitted>

  telegraf:
    container_name: telegraf
    restart: unless-stopped
    image: telegraf:latest
    volumes:
- $PWD/telegraf.conf:/etc/telegraf/telegraf.conf- Create a file telegraf.conf in the same folder where the docker-compose.yml file is located.
[[inputs.mqtt_consumer]]
  ## Broker URLs for the MQTT server or cluster.  To connect to multiple
  ## clusters or standalone servers, use a separate plugin instance.
  servers = ["tcp://<mqttserver>:1883"]

  ## Topics that will be subscribed to:
  topics = [
    "zigbee2mqtt/<sensor_id_1>",
    "zigbee2mqtt/<sensor_id_2>",
  ]

   data_format = "json"

# Use the stdout output for debugging
#[[outputs.file]]
#  files = ["stdout"]

# Network InfluxDB
[[outputs.influxdb]]
  urls = ["http://<influxdb server>:8086"]
  database = <database>
  username = <username
  password = <password>
skip_database_creation = true- Restart the images:
$ docker compose stop
$ docker compose up -d
Data Visualization
I used Grafana to view the sensor information:
