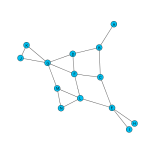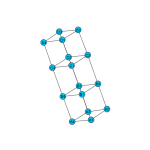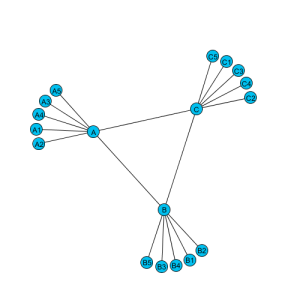
A Froce Directed Graph Layout – Click to animate
Many applications, especially those that require visualizing complex information, rely on manipulating and presenting data as graphs composed of nodes and links. A graph, in the mathematical context, is a set of objects represented as vertices, or nodes, and a set of links connecting some pairs of objects. The graph may be used in social studies to represent relationships between people. In the information technology (IT) field, the graphs may represent routing devices connected by communication links.
A pictorial presentation of a graph is achieved by assigning symbols to nodes (e.g. circles or rectangles) and links (e.g. lines or arcs) and arranging the symbols in two- or three-dimensional space in a way that reveals the inherent relationships among the objects. The presentation method is called Graph Layout and there are many methods that aim at depicting the graphs in ecstatically pleasing manner that help understand the data.
This post illustrates an implementation of a Force Directed layout algorithm described in Springy.js using Processing. In this class of layout methods, the nodes are treated as steel rings and the links are treated as springs connecting the rings. The final placement of nodes in the two-dimensional space depends on the combined attraction and repulsion forces exerted on the steel rings by the springs and other rings, respectively.
A copy of the code can be downloaded from here.